Off-site monitoring for websites, APIs, servers & cron jobs
Know the second a server goes quiet.
PylonMon watches your websites, APIs, servers, cron jobs, and backups from
outside your network — the dead-man's-switch for everything you can't afford
to lose. When the whole thing goes dark, you still get the alert.
No agent to install · Alerts to Slack, email, SMS, voice & more · Free · Pro $9/mo · Team $30/mo
# drop one line at the end of your backup / cron job:
curl -fsS https://pylonmon.com/hb/your-mon-id# miss your window, and PylonMon pages you:nightly-backup missed check-in — silent for 14m · SLA 10m
From signup to your first alert in under 60 seconds
1Sign up freeNo credit card, no agent to install.
→
2Create a monitorName it and set the check-in window.
→
3Copy one curl linePaste it into your cron job or backup.
→
4Get your first alertMiss the window and PylonMon pages you.
Every way to watch anything
Whether a job checks in with us or we reach out to it, you find out the moment an SLA slips.
HEARTBEAT
It pings us
Your cron jobs, backups, and devices curl a unique URL when they finish — they reach out to us. Miss the window and you're alerted — the silence is the signal.
HTTP · TCP · PING
We reach out
We poll a URL, open a TCP port, or ICMP-ping a host on your schedule, from off-site. Unreachable or non-200 trips an alert with the exact status. Paid tiers add DNS & UDP monitors, TLS-certificate & domain-expiry warnings, slow-response alerts, and Prometheus metric thresholds (push or pull).
EXPOSURE NEW
What the internet sees
Monitors ask “is it up?” — Exposure asks “what is it showing?” Add a domain and we watch its public surface and tell you when it changes: a TLS certificate expiring, served with a broken chain — or a chain that quietly changed — nameservers or mail records that moved, SPF/DMARC that stopped protecting you, an IP that landed on a blocklist. Verify you own a host and we watch its open ports too, flagging anything that opens that shouldn’t. Nothing to install.
ALERTS
You get paged
Email, rich Discord cards, Slack, Teams, Webex, Telegram, ntfy.sh, web push, SMS, WhatsApp, voice calls, Zapier, or any webhook — with escalation ladders on every plan, incidents, public status pages, and on-call rotations on Team. One alert per state change. No 2am nag loops.
See it in action
Your monitors, attack-surface exposure, incidents, and a public status page — all in one clean console.
example.com msapi.example msstatus page mscdn edge ms
MONITORS
example.comHTTP/S28s
api.example.comHTTP/S41s
web-01BEACON17s
web-02BEACON4s
nightly-backupHEARTBEAT4h
db-replicaTCP6m
www (A record)DNS2m
show all 11 monitors →
RECENT EVENTS
🟢web-01: cpu_pct back within limits before 2 min — no alert sent28s ago
⏳web-01: cpu_pct = 75.1 tripped (> 70.0) — pages if it lasts 2 min2m ago
🔴db-replica is DOWN — connection refused6m ago
🟢www (A record): resolved in 12 ms2m ago
⏳api.example.com: 412 ms — slow-response warning armed9m ago
🟢nightly-backup checked in — 4 min inside its window4h ago
ℹ️tls: example.com certificate renews in 38 days6h ago
INCIDENTS · 1 OPEN
db-replica is downSEV3ackresolve
open for 6m · dial tcp 10.0.0.24:5432: connection refused
all incidents →
ALERT CHANNELS
Email — ops@EMAIL
#incidentsDISCORD
Push — phonePUSH
Voice — on-callVOICE
#deploys (muted)DISCORD
show all 9 channels →
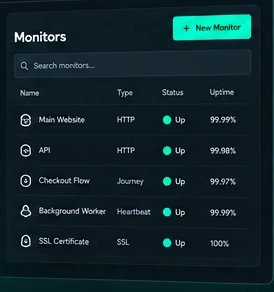
Every monitor, the live event feed, open incidents and every alert channel on one screen — with response time, CPU, memory, disk and temperature history you can point at when someone asks what happened at 3am.
Monitors
ALL MONITORS · 7 / 250
db-replica TCP
checked every 30s · dial tcp 10.0.0.24:5432: i/o timeout
example.com HTTP/S
checked every 30s
nightly-backup HEARTBEAT
SLA: check-in every 60m
udp probe UDPDISABLED
checked every 5m
Monitor list — every check, its status and cadence, with pause, edit and delete a click away.
Exposure
EXPOSURE · shop.example.com
ownership verifiedPORTS ON
Certificate valid — 38 days left
SPF is not enforcingWARN
tcp/3389 (Remote Desktop) newly openCRIT
Reputation — not on any blocklist
Attack-surface exposure — certificates, DNS, mail auth, reputation and open ports, watched from outside. Alerts on change, not noise.
Incidents
INCIDENTS (1 OPEN)
db-replica is downSEV3
open for 6m · dial tcp 10.0.0.24:5432: i/o timeout
SEV3 ▾ack+ notepublishresolve
RECENTLY RESOLVED
ota release serverSEV4resolved 7h
Incident timeline — set severity, acknowledge, annotate, publish to your status page, resolve with a write-up.
Status page
Northwind status
Some systems are having trouble
SERVICES
WebsiteUp
APIUp
db-replicaDown
Background jobsUp
Powered by PylonMon
Public status page — your brand, your title, and only the monitors you choose to share.
Discord
THE ALERT YOU ACTUALLY GET
db-replica is DOWN
Resultconnection refused
Target10.0.0.24:5432
Typetcp
Reached10.0.0.24
db-replica recovered
Down for4m 12s
The page at 3am — what failed, where, and what we saw. Discord, Slack, email, SMS, voice, PagerDuty.
home-01 · vitals
NODE VITALS (from pylon-beacon, 30s ago)
disk_pct /87.2%> 85 for 2m → pages
cpu_pct18.4%no rule
mem_pct36.2%no rule
temp_c54.1°Cno rule
load10.48no rule
RECENT RESULTS
Vitals from inside — pylon-beacon streams CPU, memory, disk & temperature, and a rule on any vital pages you before it becomes an outage.
Break something on purpose
Don't take our word for it — see your first alert in about 5 minutes, without risking anything real.
STEP 1 · 1 MIN
Create a heartbeat
Sign up free, add a heartbeat monitor called my-first-alert, set it to alert if silent for 5 minutes. You get a private ping URL.
STEP 2 · 10 SEC
Ping it once
curl https://pylonmon.com/hb/… — the monitor goes green. That's the whole integration.
STEP 3 · DO NOTHING
Now stop
Just… don't ping it again. That's the "outage." When the deadline passes, your phone lights up. Nothing real broke — but now you know exactly what the real thing feels like.
We don't sell you an AI SRE. We page yours.
Every monitoring vendor is bolting on a hosted AI that wants credentials to your infrastructure.
We went the other way: bring your own agent.
ALERT
Your agent gets paged
Add an AI agent alert channel and every alert POSTs a structured envelope to your agent — monitor state, the open incident, write-back URLs, machine-readable instructions. Or let your agent drive PylonMon natively over our MCP endpoint.
INVESTIGATE
On your infra, with your keys
Your agent already has the access you chose to give it — we never hold your credentials, run your models, or touch your instances. Agent-scoped API keys are the leash: read state, write incident notes — never create or destroy monitoring.
WRITE-BACK
Findings before you're awake
The agent acks the incident, attaches evidence as-attributed notes on the timeline, and resolves with a write-up when it's verified fixed. You open the incident and the investigation is already done — or well underway.
Our open-source agent streams CPU, memory, disk & temperature to PylonMon from any box —
a server, a Pi, a laptop. No open ports. No Prometheus. Works behind NAT. And it pages you the
second the machine goes quiet.
$ curl -fsSL https://pylonmon.com/beacon.sh | sh
✓ pylon-beacon installed · db01 online · cpu 4% · mem 38% · disk 61% · 41°C
Everything you need to run on-call for production — flat monthly pricing, never per-seat.
The price on this page is the price on your invoice. No per-host meters, no per-GB surprises, no usage tiers that spike the month something goes wrong. Your bill is boring on purpose — the alerts are where the excitement belongs.
Free
$0 / forever
20 monitors
Log search — 1-day retention, 50 MB/day
1 alert channel — email, Discord, Slack, webhook, ntfy or web push
1-minute check intervals
Heartbeat, HTTP/S, TCP & ping monitors
pylon-beacon — 3 nodes (CPU/mem/disk/temp, open source)
Every plan includes real support — a person answers, not a bot. And we will never sell your data. Launch pricing is locked for early customers — if these prices go up later, yours doesn't. See how we compare →
Questions, answered
The things people ask before signing up.
Is there a free plan?
Yes — Free is free forever: 20 monitors, 1-minute checks, and heartbeat, HTTP/S, TCP and ping monitors with one alert channel. No credit card required.
What is heartbeat (dead-man's-switch) monitoring?
Your cron jobs, backups, and scripts send a quick HTTP ping to a unique URL when they finish. If PylonMon doesn't hear from a job inside its expected window, it pages you — the silence is the signal, so you catch jobs that die quietly.
Do I need to install an agent?
No. PylonMon watches from off-site: heartbeats are a single curl line, and HTTP, TCP and ping checks run from our side. There's nothing to install on your servers.
How is PylonMon different from UptimeRobot or Healthchecks.io?
It does both at once — outbound uptime checks and inbound heartbeat/cron monitoring — plus escalation ladders on every plan, multi-region outage confirmation on every paid plan, on-call rotations on Team, Prometheus and Alertmanager support, and alerts to email, Discord, Slack, SMS, WhatsApp and voice.
What alert channels are supported?
Email, Discord, Slack, Teams, Webex, Telegram, ntfy.sh, web push, SMS, WhatsApp, voice calls, Zapier and any webhook — with escalation on every plan and one alert per state change, no 2am nag loops.
Can it monitor cron jobs and backups?
Yes — heartbeat monitors are built for exactly that. Add one curl line to the end of your job; miss the schedule and you're alerted with how long it's been silent.